What does OPS mean in Major League Baseball?
Explore the term OPS in baseball and how it is calculated during the MLB season.

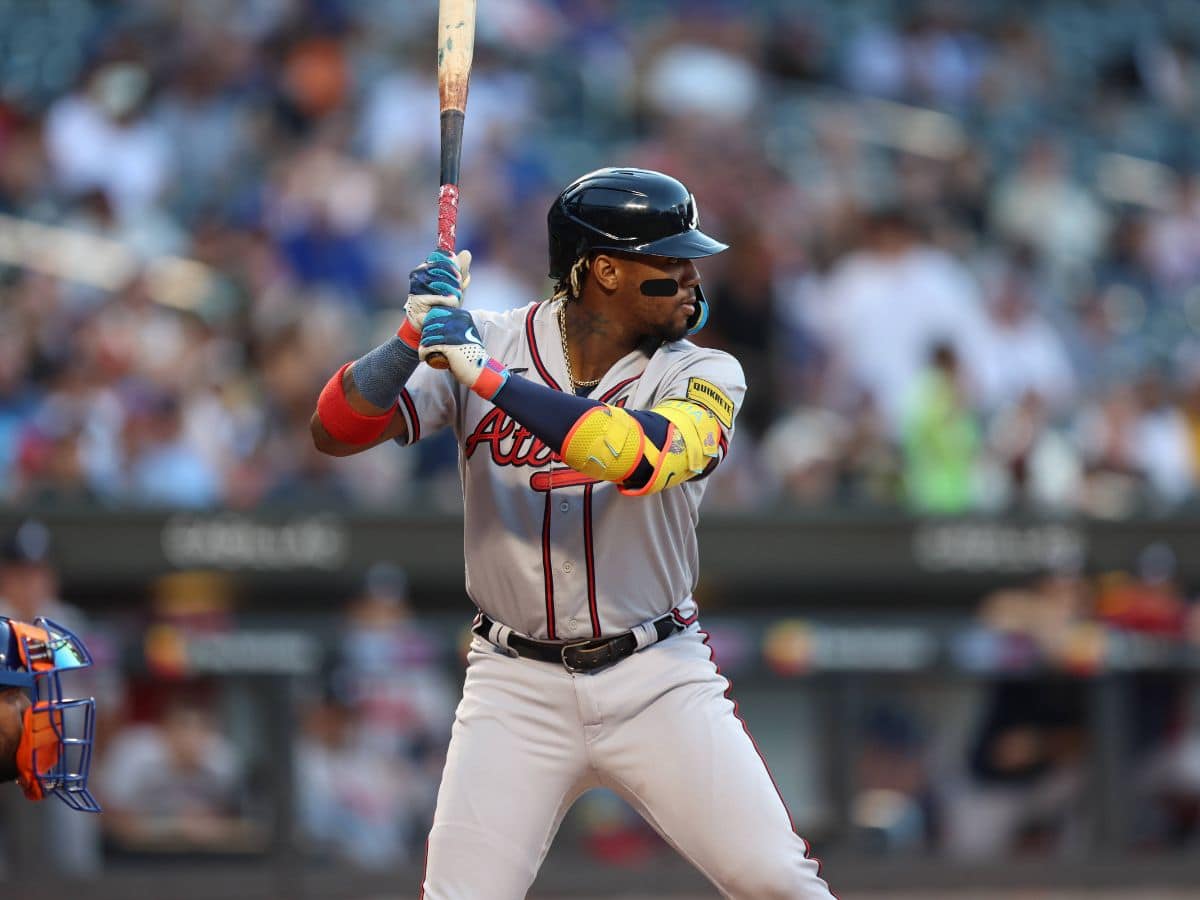
Ronald Acuna Jr. one of the top three players in OPS this season (Image credit: Imago)
The MLB postseason is here. After six months of thrilling matches and entertainment, the sport of baseball enters its final month. This regular season, several individual records were once again broken as players achieved great stats. With the modern game dominated by stats, there are some who are confused with the long range of metrics. One of them is the OPS stats. Let’s find out more about it.
For batters the three main stats are obviously the home runs, batting average, and the RBIs (runs batted in). However, there are several more terms that contribute to a hitter. The OBP (on-base percentage) and SLU (slugging percentage) determine the percentage of the batter reaching the first base and his slugging power. Together these two can be viewed as a single stat in MLB as OPS (on-base percentage plus slugging percentage).
To understand the OPS stat, one must first learn how the OBP and SLU are calculated. As the name suggests the OBP means how often one player reaches the base. Unlike batting average which is determined through the hits, on-base percentage can be measured through (HBP) hit by pitch and BB (base on balls). This along with the hits are added and divided by the total at-bats which include both BB and sacrifice fly.
Meanwhile, the slugging percentage is a little different. It is used to show the player’s ability to hit the ball well. It is determined by dividing the total number of bases by the at-bats of a player. If a player hits a single it counts as one, doubles are multiplied by two, triples are evaluated as three, and home runs are can four (as the player touches all the bases while rounding them off).
Related: Top 10 greatest MLB postseason moments
What is the OPS and Who is the leader of this stat in 2023?
As mentioned above OPS stands for on-base percentage plus the slugging percentage. Once those two stats are determined they are simply added with each other. A higher number of OPS means the player had been playing well while getting on base regularly and getting the hits. While might question how the batting average and slugging percentage can be different here is an example.
If a player gets 30 singles in 100 at-bats their batting average will be .300. However, if the same player gets 30 hits through 30 home runs in 100 at-bats will also have the same batting average but his slugging percentage and OPS will be significantly higher. This stat becomes crucial to determine the value of the player and how much of an asset they can be for a team.

As per the official stats by the MLB provided by Statscast, this year the leader of OPS is Shohei Ohtani. The two-way star once again shined brighter than anyone as he enjoyed another memorable individual campaign for the Los Angeles Angels. Despite an elbow injury putting his season to an early end, the 29-year-old Japanese star finished the season with a 1.066 OPS.
Behind him were Texas Rangers’ Corey Seager and Atlanta Braves’ Ronald Acuna Jr. with an OPS of 1.013 and 1.012 respectively. These three are the only players with an OPS of over 1.000. The top five are then filled by Matt Olson (.993) and Mookie Betts (.987). On the other end of the table, Javier Baez and Tim Anderson finished with the worst OPS of .592 and .583 respectively.
In case you missed it:
- Top 10 highest scoring MLB games in history
- How long is a baseball game in 2023 after new MLB pitch clock rule changes?


